





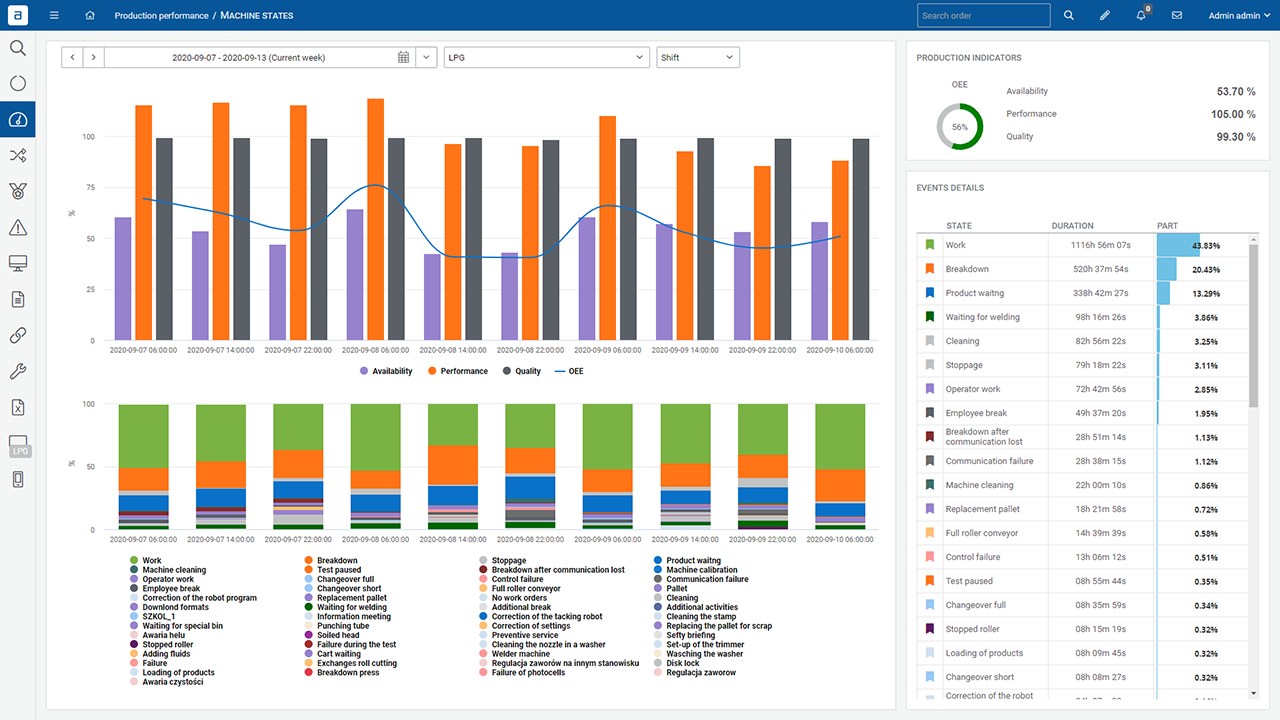

Dashboards & Reports module is a complex analytic platform with ready-to-use reports. More than dozen reports to analyze production, quality, trends and targets and get various production insights. Reports can be viewed from the perspective of plant, machine and in different time ranges.

Wie kann man den Produktionsprozess analysieren?

The daily rush makes it difficult for us to stop, create reports and production comparisons. Accevo dashboards and reports allow you to easily see your factory from different perspectives and quickly understand trends and issues. Check performance, availability and quality against specific production orders, plants divisions or machines.

Dashboard allows user to generate a report for the selected range (lines, machines, products) and time interval (date range selection, last change, last day, last week, etc.)

The system presents actual production in real-time and displays data: machine, production order, item, good/bad quantity counters, percent production progress, machine states with duration time, production status with start and estimated end datetime.
Dashboard-Berichte

Wie kann man überprüfen, warum man die Produktionsfrist verpasst hat?

The OEE waterfall is a powerful tool that will quickly give you the answer to the main reasons why your production plan is not being met. Check OEE drops defined according to your glossary and do a dig-down analysis to find root causes.

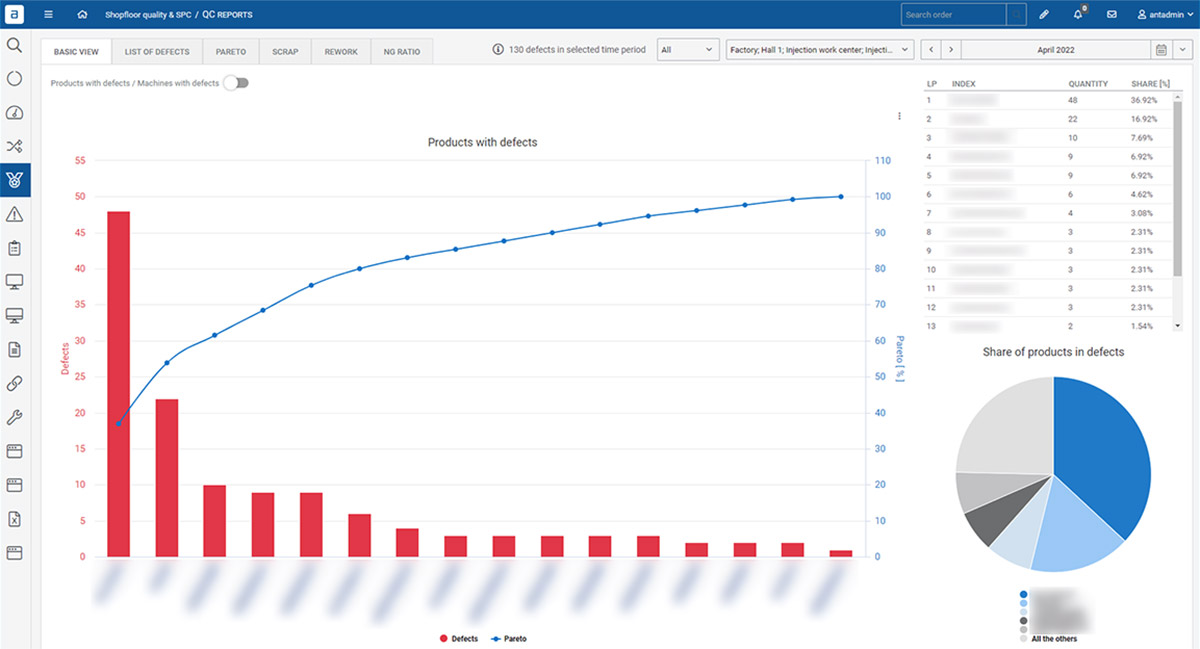
QC-Bericht

Hauptmerkmale

dashboards-berichte-verschiedene-berichte

Verschiedene Berichte für Produktion, Maschinen, Qualität

dashboards-berichte-dashboard-production

Dashboard für die laufende Produktion
dashboards-berichte-daten-analytik

Ein anderer Blickwinkel für die Datenanalytik
Wichtigste Vorteile

dashboards-berichte-automatische-berichte

Automatische und schnelle Erstellung von Berichten
dashboards-berichte-schneller-daten-zugriff

Schneller Zugriff auf aggregierte und detaillierte Daten
Dashboards-Berichte-Bericht-zu-Excel

Datenexport nach Excel zur Erstellung benutzerdefinierter Berichte
Was können Sie überwachen?

The system presents production reports:
• Shift, day, week, month summary: good and defected production, OEE
• Machine’s performance: good and defected production
• Realization of production target
• Number and duration of failures, breakdowns, microstops
• Calculated item’s real cycle time for operations
• Graphical presentation of realized production orders on machines
• Comparison machines for work time, stop time, OEE
• Production orders and operations report: statuses (planned orders, started orders, finished orders, delayed orders) and progress

The system presents machines data reports:
• Machines states time: work, microstops, failures, breakdowns
• % share of machine states
• % share of machine stop reason

The system presents quality reports:
• Defects Pareto for items and defect types
• Quantity of defects, scrap, and reworks for a selected time range
• Most defective machines and items

Also, the system presents trends charts with OEE, availability, performance, quality, production quantity, machine main state, number and time for changeovers and failures, MTBF/MTTF/MTTR

Verwandte Artikel

Wonach suchen Sie?

Hallo, anscheinend sind Sie an Software für die Produktion interessiert...

Abonnieren Sie unseren Newsletter und Sie erhalten unsere Broschüre.

By providing your email and clicking the “Download a catalogue” button, you agree to receive our newsletter.